Daily: ICIC Paper Review Response · Supplementary Experiments in Progress — March 28, 2026
Reviewer Feedback
Two days ago I received the review feedback for the ICIC paper. The four reviewers raised ten issues in total. Ranked by severity, the three most critical ones are:
- Critical — Proxy metric lacks downstream validation (raised by R1–R4): The paper relies solely on CE loss to measure fine-tuning effectiveness, without directly validating downstream generation quality
- High — Experimental scale too small (R1–R3): Experiments only cover 500–1000 trajectories, which isn’t convincing enough
- High — Missing external baselines (R1–R3): No comparison with methods like IFD/DEITA
The remaining issues — insufficient statistical visualization, overly absolute conclusions, inconsistent terminology — are relatively straightforward to address.
The deadline is April 1st. I’ve put together a 6-day revision plan.
Supplementary Experiment Design
Three supplementary experiments were designed to address the reviewers’ core concerns:
Experiment A: First-Action Evaluation
Instead of running the full SWE-bench pipeline (where 7B models have a resolve rate near 0), I evaluate only whether the model’s first generated action matches the ground truth. 50–100 instances are sampled from the test split, and inference is run on checkpoints including baseline, random_500, topq_500, and random_1000, using three levels of metrics:
| Metric | Description |
|---|---|
| Action Type Match | Whether the action type is correct (e.g., find_file vs open_file) |
| Target File Match | Whether the correct file is targeted |
| Exact Match / ROUGE-L | Precise content matching |
Finally, the Spearman correlation between CE loss and action-level metrics is computed. The expected result is ρ > 0.7, demonstrating that loss reduction genuinely reflects improved generation quality.
Experiment B: 2000-Scale Extension
Scaling from 1000 to 2000 trajectories, with the key comparison being Random-2000 vs TopQ-1000. This tests whether quality filtering starts to produce significant differences at larger scale — if yes, we’ve found the crossover point; if not, the quantity dominance conclusion extends to 2000.
Experiment C: B2-only Baseline
Comparing composite score filtering against using B2 (error-retry rate) alone, to verify whether multi-dimensional scoring truly outperforms a single metric.
Current Progress
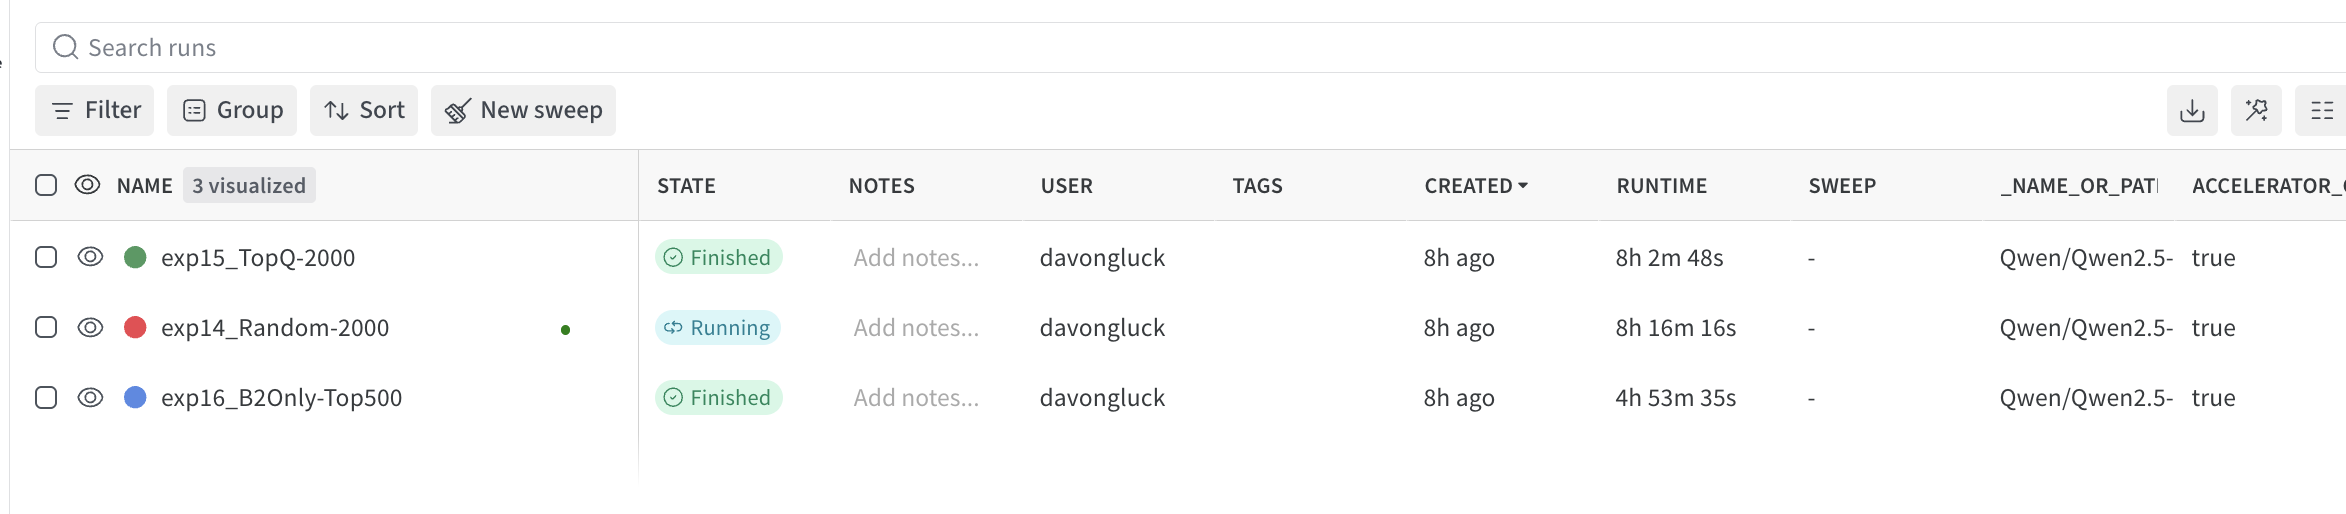
The screenshot below shows the training status of the three experiment runs on W&B. exp15_TopQ-2000 and exp16_B2Only-Top500 have finished, while exp14_Random-2000 is still running. All three use the Qwen2.5 model.
- ✅ All three experiment models have finished training
- ✅ Experiment A completed and passed cross-validation
- ✅ Experiment B & C model training complete
- ⬜ Run perplexity evaluation on models (tonight + tomorrow morning)
- ⬜ Verify correctness of First-Action Evaluation’s first step
- ⬜ Paper rewriting (structural adjustments, wording revisions, visualization upgrades)
- ⬜ Submit revised version before April 1st